JMeter – A Complete Tutorial to Enhance Web Apps Performance

While creating applications, one thing is very important to keep in mind is to know the status of app’s performance under enormous workloads. Performance software testing helps you in determining the stability and responsiveness of an application in a number of scenarios.
Even though testing plays a vital role in the application development process, a lot of developers do not give enough importance to it. If you, as a developer, do not go through the testing phase of the application development process, it might lead you to certain issues that are related to functionality, security, accessibility, and performance.
Apache JMeter is one of the great resources used for application performance testing across the world. JMeter is a complete Java application and an open-source testing tool, which is responsible for measuring the performance and load-testing the functional behavior of the applications.
In this article, we have comprehensively introduced JMeter and how it can be utilized to enhance the performance of your web apps.
So, let us start!
Introduction
JMeter is used for simulating a heavy load to analyze and test the strength of the entire performance of an application under several load types. JMeter is capable of testing the static and dynamic application resources with ease. Now, you would be eager to know more about these resources.
Don’t worry! This blog will provide you with the complete solution to all your queries.
Well! Dynamic resources include Servlets, AJAX, and JSP. On the other hand the static resources include Document Object Model (DOM) elements such as HTML and JavaScript.
JMeter does Load app testing and Stress app testing out of four main types of performance testing available in the market.
Let us understand these testing processes:
- Load Application Testing: JMeter is responsible for simulating models and users expected usage. Here users can access the web service and simultaneously allow you to know the number of users your application can support.
- Stress Application Testing: Every web service is capable of bearing some load beyond which, the system would not perform well. In simpler words, it is the breaking point for any app. In the testing phase, JMeter applies stress beyond the bearing capacity of the apps, and determines the maximum load which a dedicated server can easily handle.
What is JMeter?
Apache JMeter is a software testing tool, which is used to measure and analyze the performance of enormous software services and products. It is an open-source tool and comprehensively written in Java which is also used for testing the FTP application or Web Application.
It is also used for executing performance testing, functional testing, and load testing of web applications. JMeter was originally designed to test the web apps but now it has been extended to test other functions as well.
JMeter can run on any workstation or environment that accepts a Java Virtual Machine (JVM), for example − Linux, Windows, Mac, etc. Additionally, JMeter can also simulate a heavy load on a server by creating a number of virtual concurrent users to the web server.
Here are some terms associated to the testing of applications:
- Performance Test: This test is used for setting the best performance expectation that is possible under a given infrastructure’s configuration. It is also responsible for highlighting early in any testing process if there is any change that needs to be made before the application goes into production.phase.
- Load Test: Load test is responsible for testing the system under the top load under which it was created to operate.
- Stress Test: Stress test is used for breaking the system by overwhelming its resources.
What are the Key Features of JMeter?
The list of JMeter features is as follows:
- It is freely available as it is an open source software.
- It has an impeccable, intuitive, and simple GUI.
- JMeter can also conduct performance and load tests for various server types − Web – HTTPS, HTTP, SOAP, Database via LDAP, JDBC, Mail – POP3, JMS, etc.
- JMeter is a platform-independent tool as it can be invoked by clicking on the JMeter shell script on Linux/Unix, and can be invoked by starting the jmeter.bat file on Windows.
- JMeter features lightweight component support and full Swing (precompiled JAR uses packages javax.swing.* ).
- It can also store its test plans in XML format. In this way, it allows you to generate a test plan with the help of a text editor.
- The full multithreading framework offered by JMeter allows concurrent sampling by various threads and simultaneous sampling of several functions by individual thread groups.
- JMeter is highly extensible.
- JMeter can also be used to perform functional and automated testing of the apps.
What are the Protocols that JMeter Supports?
Several protocols that are supported by JMeter are as follows:
- Web − HTTPS, HTTP sites ‘web 1.0’ web 2.0 (flex, flex-ws-amf, and ajax).
- Service − IMAP, POP3, SMTP.
- Web Services − XML-RPC / SOAP.
- FTP Service.
- Messaging Oriented service via JMS
- Directory − LDAP.
- Database via JDBC drivers.
How JMeter Tool Works?
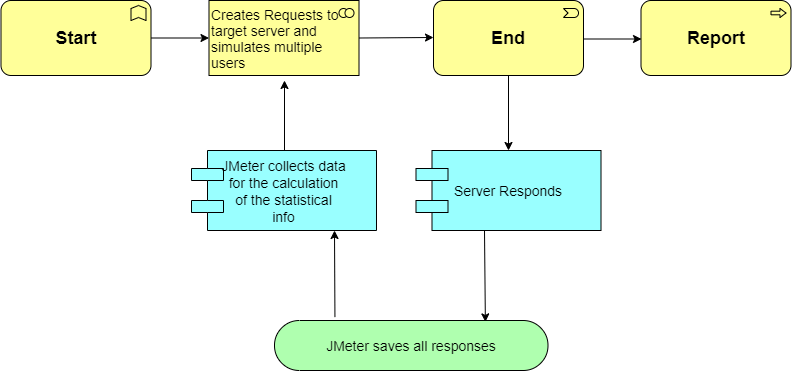
JMeter simulates the group of users sending the requests to a target server, and returns statistics, which shows the functionality & performance of the target application or server via graphs, tables, etc.
The following figure shows how JMeter works:
Creating a Performance Test Using JMeter
- The first step is to create a thread group.
- After this, add the thread properties like the number of threads, ramp-up period, and loop count.
- Now, in this step, add JMeters elements like HTTP request default, output results, and HTTP request sampler.
- Run the test.
- The last step includes analysis of the results i.e. throughput and deviation.
Now, let us further understand these steps in detail.
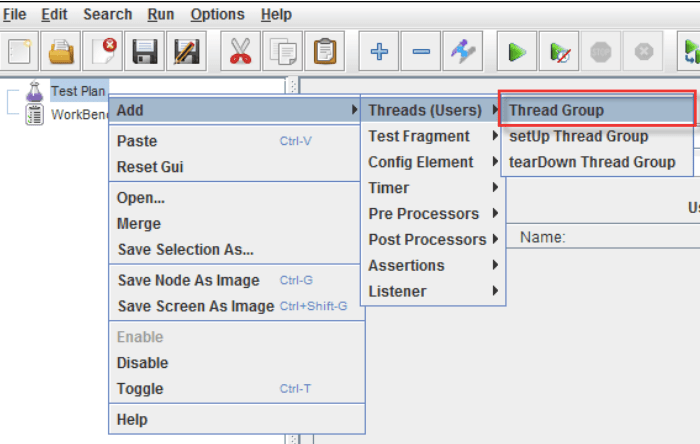
1. Create a Thread Group
In order to create a thread group, follow the steps given below:
- First, install and launch the JMeter application.
- Right-click on “Test Plan” which you can find on the left panel. A Test Plan consists of a sequence of test components that determine the way the load test will be simulated.
According to the above mentioned diagram, JMeter is creating 100 concurrent users. These users are accessing the web service all in one single time. We have set the Loop Count to 10. Therefore, every user made by JMeter is connected to the server 10 times.
Congratulations! You have successfully created a Thread and also added its properties.
3. Adding JMeter Elements
Now, let us add JMeter elements:
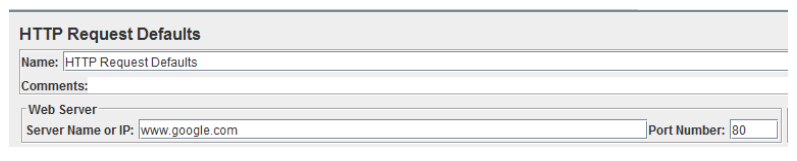
- HTTP Request Default: Here, attach the HTTP Request Defaults element to the created thread.
Follow the following steps:
- First, right-click on “Thread Group”.
- Now, click “Add,” “Config Element,”.
- After that, click on “HTTP Request Defaults.”
- Finally, enter the server or site name as per your requirement to access under “Server Name or IP.”
Below is the example how to add the JMeter element:
- HTTP Request Sampler: In this step, add the HTTP Request Sampler to the Thread Group.
Follow the below given steps to add this JMeter element.
- First, right-click on “Thread Group.”
- Now, click “Add,” “Sampler.”
- Finally, click on “HTTP Request.”
The below image shows the process how to add this JMeter element:
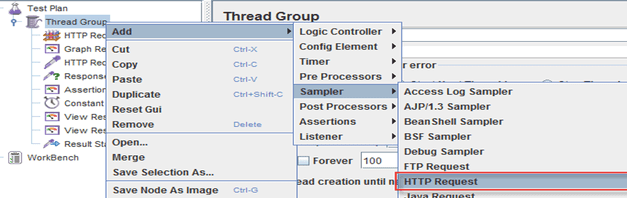
Suppose you do not enter any parameter in the Path field, then, in this case, the user will only request www.google.com. There is no need to specify Google here as it is specified already in the HTTP Request Defaults item.
- Output Results: JMeter includes listeners to output the load test results.
Follow the below steps:
- First, right-click on “Thread Group.”
- Now, click “Add,” “Listener.”
- Finally, click on “Graph Results.”
JMeter is a very efficient and powerful tool that shows the results in a graphical format.
Read Also:-https://4waytechnologies.com/blog/ios-app-design-and-development/
4. Running the Test
After setting up the basic test plan, it is time to run it and analyze the results.
Follow the below steps in order to run the test.
- First, under “Test Plan” and “Thread Group,” click on “View Results in Table.”
- Now, click on “Run” from the main menu.
- After this, click on “Start,” which is located as a green start arrow under the main menu, in order to start the test.
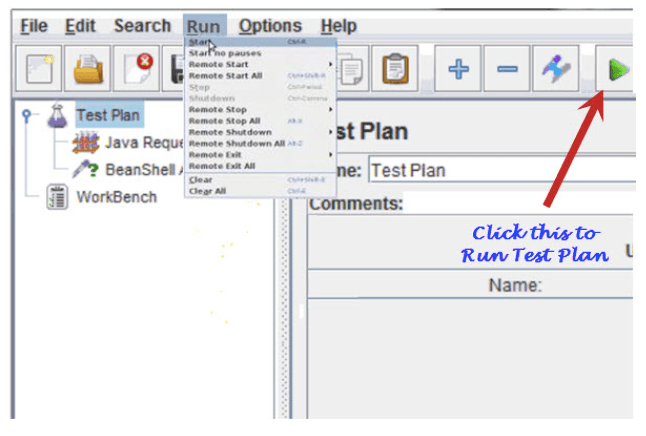
As the test is run, the results appear in the table in real-time. In our example case, 100 users would be accessing the Google server simultaneously, with every user connecting to the server 10 times.
5. Analyzing the Results
After carefully analyzing the real time graph. There are two main factors that you need to consider:
- Throughput: It is the server measuring capacity, or how much the server can handle. Generally, this number must be infinite, if it is not very high.
Important! Throughput also depends on various other factors like the internet speed, the current load of Google’s server, and power of the CPU. These factors change continuously, which means you would not get the similar results every time you start and run the test.
- Deviation: It is the variation from the average. This number must be equal to zero, or very low.
The output report in this scenario comes in five colors, and every color defines something different:
- Black – It signifies the total number of samples sent to the server.
Blue – It signifies the average of the total number of samples sent to the server.
- Red – It signifies the standard deviation in real-time output.
- Green – It signifies the throughput rate.
- Purple – It signifies the median, which is a number that divides the samples into two equal halves.
What is the Importance of Performance Testing?
JMeter is responsible for doing both stress and load testing. Load testing models simulate concurrent users. However, stress testing models determine the maximum load that a web server can handle. These test results help you in reducing the bottlenecks and boosting the performance.
Testing is the most valuable part of any software development process. We have only explained JMeter in this article, but there are a number of automated QA software testing solutions available in the market. Choose your development partner wisely in order to help your business cruise testing nuances for ensuring the application offers users with an impeccable user experience.
Read Also:-
https://4waytechnologies.com/blog/create-login-screen-using-textinputlayout-in-an-ios-app/
Conclusion
Thus, after going through the above mentioned article, we hope you will find it helpful. Here we understand that testing is the most critical part of any software development process. Performance testing is a vital step to determine the performance of your web apps under heavy loads. JMeter is an ideal tool for performance testing, as it has the ability to discover various users that your web app can handle.

4 Way Technologies is a premium IT services company that develops web, mobile, and SMART TV applications using cutting-edge technologies like React, Node.JS, Deno, Go lang, AWS, and AEM. We establish our thought leadership by sharing content and insights around technology.