5 Important Tools for Docker Monitoring
Container Technology
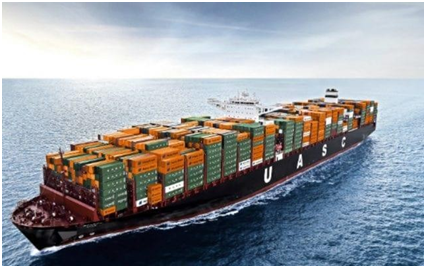
Little people know container technology is inspired by the ship containing technique. Container technology also known as simply container is a method of packaging an application so that the application can run with its dependencies in an isolated environment. The container consists of code, configuration files, binaries, software, dependencies, and libraries. Containers facilitate the deployment of software to a server. Containers are building blocks of microservices. The container is a technology used to run an application quickly and reliably from one computing environment to another. Container technology is obviously cost-effective and one of the most efficient techniques to run the applications. There are many advantages of Containers –
- Agile environment
- Enhanced Productivity
- Version Control
- Cost-Efficient
- Computing Environment Portability
- Standardization
- Security
Some of the container technology utilizers are –
- Docker
- CRI-O
- rktlet
- Containerd
- Microsoft Container
What is Docker?
Docker is a set of the platform as a service (PaaS) products that use OS-level Virtualization to deliver software packages (containers). Containers are isolated from one another, they bundle their own software, configuration libraries, and files, they communicate with each other through well-defined channels. All containers are run by a single operating system kernel and are very lightweight than virtual machines. The host software of the containers is called Docker Engine. Container image while executing push it to the Docker Engine. The Docker services are premium and free. Docker bedbug the application as well. Docker is a platform for driving digital transformation across the entire application portfolio, supporting cloud and hybrid architectures.
Docker Architecture
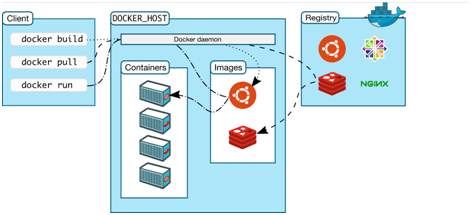
Docker follows the client-server architecture. The Docker has two major components – Docker Client and Docker Daemon. The Docker client (docker) is the primary way that many Docker users interact with Docker. The docker command uses the Docker API. The Docker client can communicate with more than one daemon. The Docker daemon (dockerd) listens for Docker API requests and manages Docker objects such as images, containers, networks, and volumes. A daemon can also communicate with other daemons to manage Docker services. Docker Daemon runs and distributes the Docker containers of the applications. Docker Client and Docker Daemon can run on the same system. Docker clients can also connect and work with remote Docker Daemon. Docker consists of –
- Docker Client
- Host
- Docker Daemon
- Containers
- Images
- Docker Daemon
- Registry
Docker Monitoring
Docker allows applications to be encapsulated in self-contained environments, and hence constant Docker monitoring is needed. Docker monitoring is about keeping a check whether the code of the application is running and performing to the expected level. It is a systematic review process aiming to observe and check the quality and progress of such an application over a period of time. Docker monitoring is not only about monitoring but several other things as well like –
- Application performance
- Finding and fixing the application performance
- Monitoring container status and resources
- Database container queries and performance
Two types of monitoring –
- White-Box Monitoring
Monitoring of all the components of the applications. All the insights of Docker. - Black-Box Monitoring
Monitoring of only the resources. Outer overview of just the resources.
5 Important Tools for Docker Monitoring
Containers are large in numbers choosing the right monitoring tools/software is a must. Docker container monitoring tools are crucial for maintaining performance efficiency and detecting performance problems. Choosing the right monitoring tool out of several Docker monitoring solutions will ensure increased health, performance, and availability of your Docker containers. So now we are aware of the containers and the importance of Docker monitoring, let us look at the ways in which this can be achieved. There are a lot of tools to monitor Docker containers.
But the 5 important tools are –
Sysdig

Sysdig is an open-source, cross-platform, powerful, and flexible system monitoring and troubleshooting tool for Linux; it also works on Windows and Mac OSX but with limited
functionality and can be used for system analysis, inspection, and debugging. A developer could effectively see all the applications running inside the containers, and that makes Sysdig incredibly powerful. Sysdig runs Cloud-Native Workloads In Production with confidence. With Sysdig one can embed security and compliance into the application build, run and respond workflows — so one can deliver on user and enterprise requirements, at scale, with a single platform. Sysdig is a universal system visibility tool with native support for containers. Sysdig is a simple tool for deep system visibility, with native support for containers. Sysdig developers developed Sysdig to give developers easy access to the actual behavior of the Linux systems and containers. Sysdig unites the Linux toolkit into a single, consistent, easy-to-use interface.
And Sysdig’s unique architecture allows deep inspection into containers, right out of the box, without having to instrument the containers themselves in any way. Sysdig instruments your physical and virtual machines at the OS level by installing them into the Linux kernel and capturing system calls and other OS events. Sysdig also makes it possible to create trace files for system activity. This way, problems can be analyzed at a later time also, without losing important information. The rich system state is stored in the trace files so that the captured activity can be put into full context.
Sysdig doesn’t only give the view of the Docker containers but gave the view into the Docker containers. Sysdig as a Docker monitoring tool has per objective to get proper visibility of what is happening inside the containers. Sysdig is based on transparent instrumentation to aggregate metrics from Docker containers in real-time in order to provide meaningful dashboards and alerts related to the running applications. It is a hosted service, that works differently compared to the other monitoring tools. The idea is to use an agent related to Sysdig, that sits at the operating system level instead of installing an agent on every Docker container. This agent understands the processes that are running in the system and the services running in a container. The container-native monitoring is displayed in Sysdig dashboards as arrays coverings CPU usage, memory consumption, network usage, File I.O, and other Performance metrics. When running the Docker containers in the hosts, they will appear in the console of Sysdig too. One can select any host, or a container so that one can see its proper metrics and dashboards. Another option offered by Sysdig is live metrics, where one can control the containers in real-time thanks to real-time mode. The developer can define comparisons
between 2 different moments, to evaluate the application’s performance as well. The Sysdig supports very detailed alerting criteria, and presents a very useful UI to manage these alerts, and define its rules.
Sysdig Features –
- It is fast, stable, and easy to use with comprehensively well documented.
- Comes with native support for container technologies, including Docker, LXC.
- It is scriptable in Lua; offers chisels (lightweight Lua scripts) for processing captured system events.
- Supports useful filtering of output.
- Supports system and application tracing.
- It can be integrated with Ansible, Puppet, and Logstash.
- Enable sample advanced log analysis.
- It also offers Linux server attack (forensics) analysis features for ethical hackers and lot’s more.
- Cloud solution
- Detailed metrics
- Great visualization tools for real-time and historical data.
Official website: Sysdig
Availability: 20 USD per Host
CAdvisor

CAdvisor (Container Advisor) provides container users with an understanding of the resource usage and performance characteristics of their running containers. CAdvisor is written in the Go programming language. It is a running daemon that collects, aggregates, processes, and exports information about running containers. Specifically, for each container, it keeps resource isolation parameters, historical resource usage, histograms of complete historical resource usage, and network statistics. This data is exported by container and machine-wide. CAdvisor supports exporting stats to various storage driver plugins.
CAdvisor has native support for Docker containers and can support any other container type out-of-the-box. CAdvisor’s container abstraction is based on lmctfy’s so containers are inherently nested hierarchically. CAdvisor aims to improve the resource usage and performance characteristics of running containers. The containers in CAdvisor can collect, process, aggregate, and export information related to the running containers.
CAdvisor Features –
- Advise on the performance of a container (e.g.: when it is being negatively affected by another, when it is not receiving the resources it requires, etc.).
- Auto-tune the performance of the container based on previous advice.
- Provide usage prediction to cluster schedulers and orchestration layers.
- Graphical dashboard for metrics and statics
- Support docker API
Official website: cAdvisor
Availability: Open Source tool
Prometheus

Prometheus is a free software application used for event monitoring and alerting. It records real-time metrics in a time series database (allowing for high dimensionality) built using an HTTP pull model, with flexible queries and real-time alerting. The software is written in Go programming language and licensed under the Apache 2 License and is a registered software on the Cloud Native Computing Foundation. Prometheus was originally built by SoundCloud.
Prometheus scrapes data from the data points on hosts, storing it in its own time-series database. Prometheus has its own data source. Prometheus can be used to monitor computer systems and alert sysadmins about the health of our environment. Once the metric endpoints are integrated into their time-series database, the rest of the Prometheus monitoring toolset can be used to observe metrics and raise alerts if any component is performing badly or not up to the mark. Related metrics and graphs are displayed in a UI dashboard based on the Grafana toolkit.
Prometheus is an open-source program offering comprehensive Docker monitoring along with broader network monitoring tools. It can be useful for basic Docker monitoring. The developer can configure an exporter for third-party data, including data from Docker containers, to help ensure one gets the metrics needed. When it comes to Docker, Prometheus needs a container exporter that will capture metrics and collect data, so that it can be analyzed later. Once integrated with Docker, Prometheus offers a visual interface complete with graphical displays and a detailed UI dashboard. It comes with a built-in expression browser and integration with Grafana. You can also configure precise alerting capabilities based on PromQL.
Prometheus Features –
- A multi-dimensional data model with time series data identified by metric name and key/value pairs.
- PromQL, a flexible query language to leverage this dimensionality.
- No reliance on distributed storage; single server nodes are autonomous.
- Time-series collection happens via a pull model over HTTP.
- Pushing time series is supported via an intermediary gateway.
- Targets are discovered via service discovery or static configuration.
- Multiple modes of graphing and dashboarding support.
- Competitive UI.
- High analytical capabilities.
- Capacity to raise alerts.
- High level of aggregation.
Official website: Prometheus
Availability: Free
Docker API
Docker API is a basic Docker monitoring tool provided for free by Docker itself. It’s an API with basic monitoring services, pre-built into the Docker engine. The Docker API is included in the Docker engine client which is docker stats command line. Docker API doesn’t notify with the alerts or complex multi-container analytics but does offer statistics on a wide range of container functions such as network function, disk space, CPU usage, and memory. In addition to previous traditional Docker monitoring traits, Docker API can keep tabs on the volume of data being processed in the container, which can yield important information about the
presence of errors or other capacity struggles. As Docker API doesn’t provide an alert system but its live analytics allow the user to quickly detect inabilities in the container usage. Docker provides an API for interacting with the Docker daemon (called the Docker Engine API), as well as SDKs for Go and Python. The SDKs allow the user to build and scale Docker apps and solutions quickly and easily. If someone doesn’t work on Go or Python, he/she can use the Docker Engine API directly. The Docker API is used directly in the command line web and provides all of the basic data the user wants.
Docker stats give a sketch of some metrics user needs to collect to ensure the basic monitoring function of Docker containers. This API gives the user access to CPU usage, memory, networking information, and disk utilization for a running Docker container. It is about displaying a live stream of container(s) resource usage statistics. To check statistics related to a running Docker container, the user can simply run docker stats with the wanted options, associated with the name of the container. If there is no specified name or specified container, Docker stats by default display all the existent containers and their statistics. Docker stats shows the percentage of CPU utilization for each container, the memory used, and the total memory available to the container. Added to this the user can also see total data sent and received over the network by the container. Docker stats is a quick data stream, that displays a detailed summary of important parameters related to the Docker container automatically. The only disadvantage is that the displayed data is not stored anywhere, so all this is captured instantly related to the real-time status of the container. That’s why, one cannot consider tracking with docker stats as a monitoring tool, as reviewing the metrics and understanding
what is really happening with the containerized application is a bit tough. The Docker API
doesn’t allow the user to create charts and dashboards that unite the metrics across the entire application cluster. This tool is simply for assembling the data. If someone likes to visualize dashboards/charts for metrics like CPU usage, memory, disk utilization, etc. for all containers running in the system, he’ll have to import the data into a visualization tool.
Docker API Features –
- Deployed with the Docker daemon
- Quick to use
- Basic metrics and statics
Official website: docker docs
Availability: Open Source API
Sematext

Seamtext’s monitoring product goes beyond just collecting metrics, it’s about a lot more. Sematext is a Docker-native monitoring and logging solution that gathers and processes infrastructure and application performance. It traces Docker metrics, events, and logs for all auto-discovered container and cluster nodes. This is a powerful tool, that has its own log management solution and provides very high-performance monitoring and even faster troubleshooting. Sematext consists of a single agent that captures logs, metrics, and events for all containers and their hosts automatically. It operates as a single container on every Docker host, in order to render processing and automatic collection of Docker metrics. Sematext provides full-stack visibility so the business user can extract value and decide according to the performance. Sematext supports a lot of tools and cloud platforms such as Docker Swarm, Docker Cloud, Docker Datacenter, Amazon EC2, Kubernetes, Google Container, etc. Sematext delivers real-time performance monitoring capacity, log management, events, and alerts.
Sematext pulls together almost all of the performance-related monitoring tools that organizations need to troubleshoot performance issues faster. Sematext Application and Infrastructure Monitoring allows the user to gather the metrics and events across the whole stack with over 40 integrations. Sematext gets started within a few minutes with amazing dashboards, alerts, and exceptional detection rules, and expertise to analyze metrics by a number of context-aware filters. The integrations cover several key features. The user can have Server Monitoring that gives a complete insight into the utilization of the application servers and cloud instances. Monitor Containers with Sematext Agent, which is deployed seamlessly with Docker or Kubernetes.
Users can run it with a single “docker run” command or via docker-compose. It runs on Kubernetes as well as a DaemonSet, but can also run as a Docker Swarm service, with Rancher, or with Marathon for Mesos or DC/OS. Sematext detects and troubleshoots production & performance issues with logs, metrics, and real user monitoring. All in one place.
Sematext Features –
- Sematext is light and native. It runs as a minimal container on any of Docker hosts.
- It collects everything – host and container metrics, and events.
- Sematext has Docker monitoring & alerting with pre-built Docker monitoring dashboards and container alert rules.
- Real-time performance.
- Log management solution.
- Performance monitoring service.
Official website: Sematext
Availability: depends on the data transfer rates on the basis of per day.
Conclusion
Container technology has become a major part of DevOps development in the last couple of years. Containers provide freedom from software dependencies and platforms for scalable software architectures. Nowadays developers are using containers in large numbers which obviously become operationally hard to handle. Even today, many businesses and individual developers aren’t aware of proper monitoring setups. This creates a huge drawback and leaves the systems exposed to downtime and attacks.
And hence, it is necessary to monitor all layers of the application together, so whatever happens at whichever container can be, seen and rectified at the same time without any delay.
Docker is the most popular container technology because of its ease to use and speeds up development. Many of the Global Fortune 500 companies have spent a lot of money on Docker as it’ll be really profitable in the near future. Docker releases new versions quarterly with totally new features. As of today, no other container technology can compete with Docker.

A freelancing blogs and e-books writer who keeps you up with the trending technologies and user guides. A blogger who is currently a post-graduate living in United Kingdom and trying to make her niche as a Data Scientist. Before taking a deep dive into the "Data-World", she got a Bachelor's Technology degree in Computer Science and has always dreamed of writing as a kid which inspired her to write wonderful content with the right amount of technical terms to make it easy for the beginners and as well full-fledged developers to grasp a hold onto the computer technologies.